
Making Weighty Decisions
Background | Journal Videos | Class Videos | Issues Matrix
Welcome to this multimedia case study of a four-day lesson in an eighth-grade mathematics classroom in a large urban school district.
Background Information
About the Teacher
The teacher in this case study, Kay McClain, is an experienced teacher; she has taught mathematics for 17 years at the 7th through 9th grade level. At the time of this filming, she was a professor of mathematics education at Vanderbilt University where she worked with preservice teachers. Dr. McClain worked with the students in this case study for one week prior to the lesson.
About the School
This case study involves a four-day lesson sequence in an eighth-grade classroom at a public school, John Trotwood Moore Middle School, in Nashville, Tennessee. J. T. Moore enrolls students in grades 7 and 8 and is one of 32 middle schools in the Metropolitan Nashville-Davidson County School District. The school district is the 46th largest urban school district in the United States, and has about 72,000 students, of which 50% are Caucasian and 44% are African American. Approximately 45% of the students qualify for free or reduced lunches, and almost 80% of students graduating from a district high school pursue post-secondary education.
J. T. Moore Middle School has approximately 470 students, evenly split between 7th and 8th grade, and an average daily attendance of 94%. The school has a student-to-teacher ratio of 26.1 to 1. Over 60% of the teachers at J. T. Moore have at least 10 years of teaching experience and almost half of the teaching staff have earned masters degrees. The school day at J. T. Moore is divided into seven class periods of 45 minutes each; the school staff has chosen to have more periods per day than in the past (seven versus six) so that the number of students in each class is reduced. This also makes the class periods shorter in length. J. T. Moore is organized into four teams, two in each grade. Each team contains a mix of students based on gender, stanine scores and race so that the teams are similar. Teachers are assigned to a team so that all students on a team have the same science, social studies and language arts teachers. The students in this case study are on the Red team at J. T. Moore.
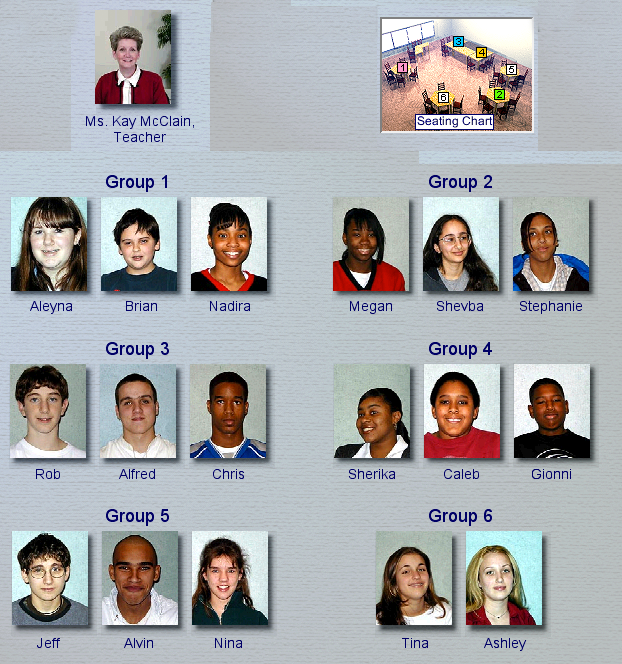
About the Students
The eighth-grade students in this case study are in a pre-algebra class, which follows a state-mandated curriculum that is designed to prepare them to take algebra the following year. The class is comprised of nine girls and eight boys, and is inclusive, with several students having Individualized Education Plans (IEPs). Students at J. T. Moore are tested and placed in mathematics classes according to test results, stanine scores, prior year’s grades and teacher recommendation. An eighth-grade student takes either a pre-algebra, algebra I or geometry class. Approximately 2/3 of the eighth graders are in pre-algebra, 1/4 are in algebra I, and 1/12 are in geometry. An eighth grader at J. T. Moore also takes language arts, social studies (concentrating on American history), science (general science or an introduction to physical science) and physical education. All students also receive instruction in art, music and computers. Electives include chorus, band, strings, Latin I, Latin II, and Spanish I. The filming for the case study took place in the middle of the school year; the students had just completed three out of six grading periods.
About the Lessons
This lesson sequence is part of a unit on data analysis. Within this particular lesson sequence, the primary focus is on ranking data and aggregating ranked data with attention being given to weighted ranks. In thinking about a learning trajectory for this initial lesson sequence, it is important to highlight the mathematical issues involved in comparing ranked lists which have been created from (a) summing ranks across lists, and (b) averaging ranks across lists. Students’ understandings of average are typically grounded in an algorithmic approach which hides the importance of average in terms of what it tells you about a data set. The relationship between the sum and the average is not well understood by students. Many students think that the sum is a more accurate measure of the data set and that an average is only an approximation. These mathematical issues can be teased out by having students compare the results of aggregating ranked lists by both summing and averaging. It is expected that this comparison will help build students’ understandings of both rank and average. These mathematical issues can be revisited and built upon in the subsequent problems in this lesson sequence and later in this unit.
The second and third problem in this lesson sequence present opportunities to revisit the notion of sum versus average when ranking data, and to introduce weighted ranks. The need to share and describe students’ systems presents opportunities to express their mathematical activity with symbols. The context of the problems provides a realistic setting in which to discuss the role of data analysts and how analysis is guided by purpose.
These mathematical issues should be viewed as emerging from the context of this lesson sequence and should serve to guide the teacher’s decisions about which methods to highlight and how to orchestrate whole-class discussions.
This Classroom
Resources
Lesson Plans: Prior Activities Before Ranking Sequence, Day 1, Day 2, Day 3, Day 4
Class Hand-outs: Ranking Result, Day 2, Day 3
Study Guide Questions: Day 1 Questions, Day 2 Questions, Day 3 Questions, Day 4 Questions, Overall Thoughts, Mathematical Explorations
References
- Goodchild, S. (1988). School pupils’ understanding of average. Teaching Statistics, 10, 77-81.
- Hofstetter, E. B., & Sgroi, L. A. (1996). Data with Snap, Crackle, and Pop. Mathematics Teaching in the Middle School, 1(9), 760-764.
- Jacobs, V. R. (1999). How do students think about statistical sampling before instruction? Mathematics Teaching in the Middle School, 5(4), 240-246.
- Korithoski, T. P., & Korithoski, P. A. (1993). Mean or meaningless? Arithmetic Teacher, 41(4), 194-197.
- McClain, K. (1999). Reflecting on students’ understanding of data. Mathematics Teaching in the Middle School, 4(6), 374-380.
- Meyer, R. A., Browning, C., & Channell, D. (1995). Expanding students’ conceptions of the arithmetic mean. School Science and Mathematics, 95(3), 114-117.
- Mokros, J., & Russell, S. (1995). Children’s concepts of average and representativeness. Journal for Research in Mathematics Education, 26(1), 20-39.
- Russell, S., & Mokros, J. (1996). What do children understand about average? Teaching Children Mathematics, 2(6), 360-364.
Credits
This online multimedia case study has been created under NSF Grant #REPP-9725512.
Principal Investigators: Janet Bowers, San Diego State University; Helen Doerr, Syracuse University; Joanna Masingila, Syracuse University; Kay McClain, Vanderbilt University
Video Producer: Eddie Baker
Programmer: Yan Huang
This online multimedia case study is based on a CD version.
CD Version Programmer: Jeff Sale
Graduate Assistants: Valerie Teich, Syracuse University; Susan Bright-Moore, Vanderbilt University; Garrett Kenehan, San Diego State UniversityWe would like to express our appreciation to Ms. Linda Scott, her students, and the administrators of Moore Middle School and the Metropolitan Nashville Public Schools for their collaboration on this project.
Information and comments, please contact Janet Bowers.